Implementing OIH Queue Monitoring
Open Integration Hub does not include a queue monitoring solution out of the box, but as a framework it provides all the necessary hooks to deploy a solution.
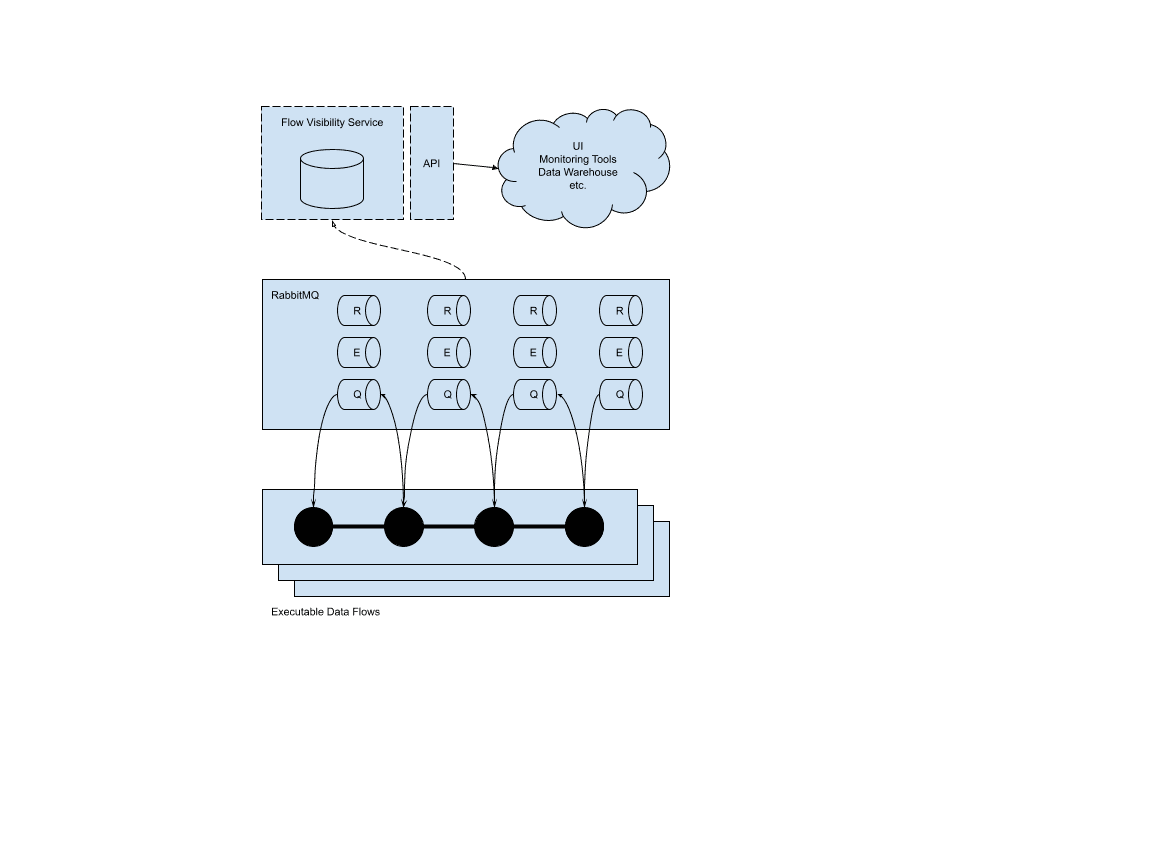
Consider the following diagram, which logically describes how you would observe OIH queues to surface flow execution information.

Each step of each flow broadcasts events to one of three queues. This is literally what’s happening when a component “emits”.
Each flow step is a configuration of one of the deployed components. Each flow step consumes from queues to do its job in the flow, that job being defined by the flow step’s configuration. When the step has done its job, manipulating the data payload, it does one of three things:
- It sends the updated data payload to the queue for the next step(s) for further processing
- It sends the data payload to an error queue
- It sends the data payload to a rebound queue to be tried again according to the rebounding algorithm (gradual backoff)
A service, be it custom or off-the-shelf, can monitor these queues to collect all information about what is happening across all executable flows. That service would store that information in a database and surface the data via an API or otherwise appropriate interface.
The service for consuming queue messages is not available out of the box in Open Integration Hub, so consider this documentation a guide for how to architecturally accomplish it. The specific implementation will be heavily dependent on what you want to do with the data.
